Press pack
Everything you need to write the story: headlines, quotes, tables and images. Free to use with a credit and a link.
Key figures · September 2026
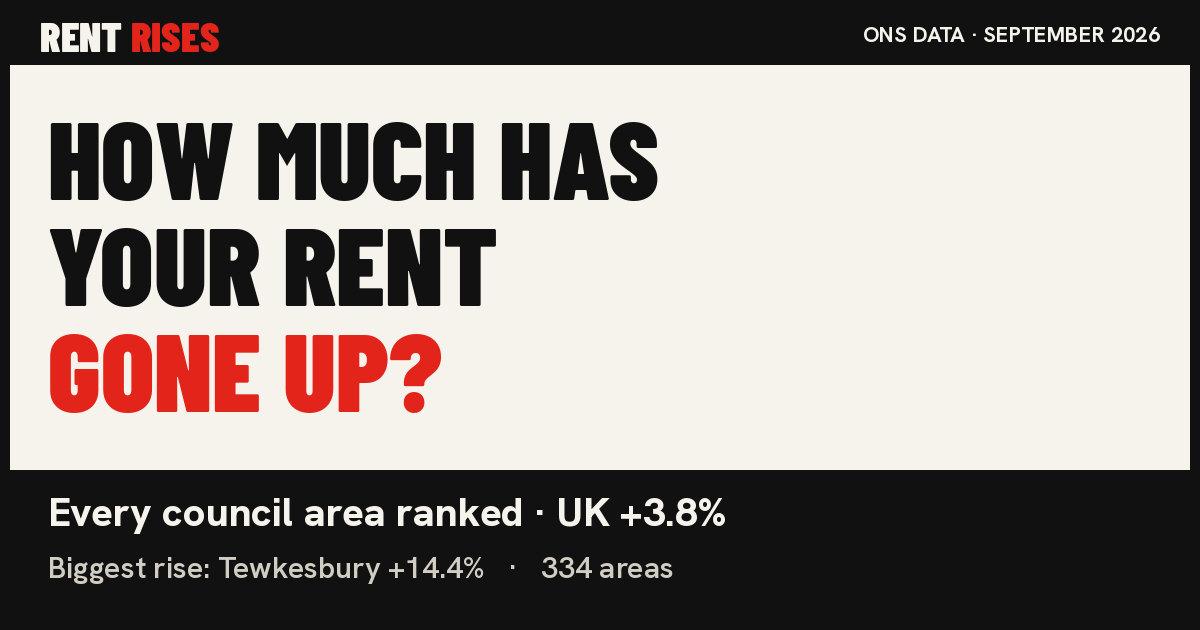
- UK average private rent: £1,406 a month, +3.8% in a year.
- Biggest rises: Tewkesbury (+14.4%), Oldham (+13.3%), Kirklees (+12.5%).
- Smallest rises: Argyll and Bute (-4.0%), North Lanarkshire (-3.5%), Merthyr Tydfil (-1.9%).
- Rent rose in 318 of 334 areas and fell in 16.
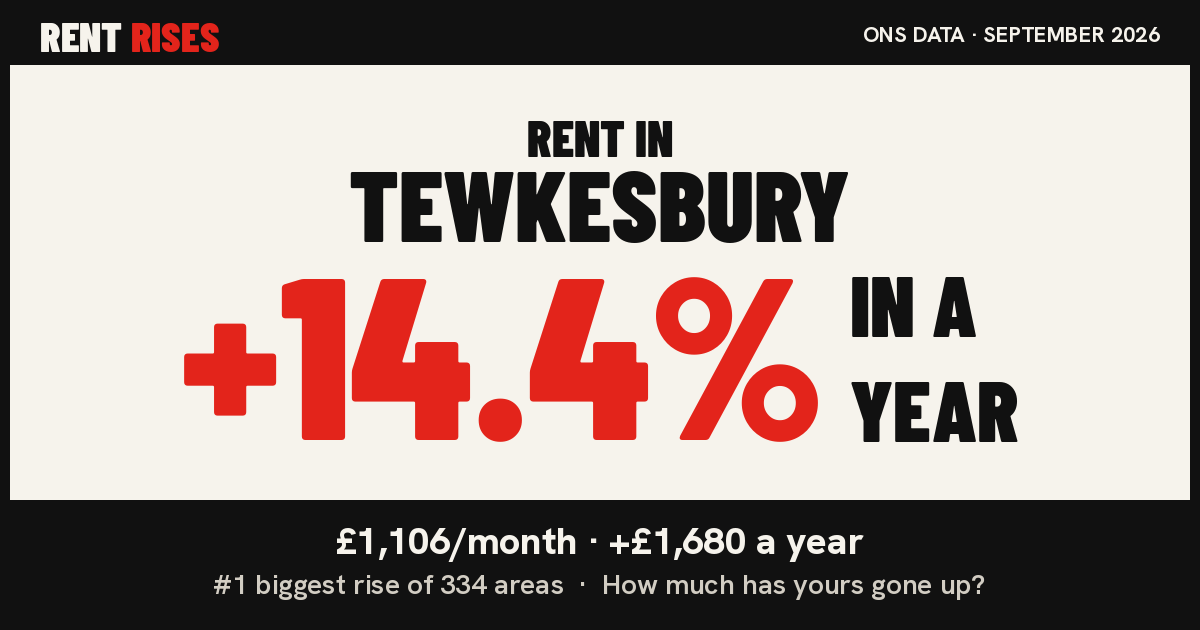
- Biggest cash increases: Islington +£2,148 a year; Southwark +£2,052 a year; Tewkesbury +£1,680 a year.
Headlines you can use
- Revealed: the 10 places in Britain where rents are rising fastest
- Tewkesbury named the place where rents are rising fastest in Britain, up 14.4% in a year
- Rents up 3.8% nationally, but renters in Tewkesbury, Oldham and Kirklees face double-digit rises
- Is your rent rising faster than average? Every council area in Britain ranked
Standfirst: Private rents rose 3.8% across the UK in the year to September 2026, official ONS figures show, but the increase ranged from +14.4% in Tewkesbury to -4.0% in Argyll and Bute.
Quotes
Attribute to James Brooks, creator of Rent Rises (curiousjames.com/rent). Use as written or trim.
“The headline 3.8% figure hides a postcode lottery. In Tewkesbury rents are up 14.4% in a year, while in 16 areas they actually fell. Where you rent now matters more than ever.”
James Brooks, creator of Rent Rises
“These numbers aren't just new lets. The ONS index covers people already in their tenancies, so a double-digit rise in places like Oldham and Kirklees is landing on existing renters too.”
James Brooks, creator of Rent Rises
“In Islington the average renter is paying around £2,148 more a year than twelve months ago. That's a serious hit for any household budget.”
James Brooks, creator of Rent Rises
“Neighbouring councils can tell completely different stories. That's why I've broken it down area by area, so every local paper can see what's really happening on its patch.”
James Brooks, creator of Rent Rises
“Rents are rising almost everywhere: 318 of 334 council areas saw increases. The question for renters isn't whether their rent is going up, it's how fast.”
James Brooks, creator of Rent Rises
“Official data like this is free, but it's buried in spreadsheets. I built this so anyone can find their area in seconds and see how it compares.”
James Brooks, creator of Rent Rises
Top 10 rises
| # | Area | Avg rent | 1 year |
|---|---|---|---|
| 1 | Tewkesbury | £1,106 | +14.4% |
| 2 | Oldham | £951 | +13.3% |
| 3 | Kirklees | £784 | +12.5% |
| 4 | Redditch | £982 | +11.3% |
| 5 | Knowsley | £860 | +11.0% |
| 6 | Wolverhampton | £948 | +10.7% |
| 7 | Dover | £1,037 | +10.2% |
| 8 | Derbyshire Dales | £828 | +10.1% |
| 9 | Folkestone and Hythe | £1,189 | +10.0% |
| 10 | Bolton | £902 | +9.7% |
Smallest rises & falls
| # | Area | Avg rent | 1 year |
|---|---|---|---|
| 334 | Argyll and Bute | £806 | -4.0% |
| 333 | North Lanarkshire | £800 | -3.5% |
| 332 | Merthyr Tydfil | £754 | -1.9% |
| 331 | Renfrewshire/Inverclyde | £805 | -1.8% |
| 330 | Broxtowe | £943 | -1.6% |
| 329 | Wyre Forest | £838 | -1.2% |
| 328 | Aberdeen and Shire | £844 | -1.2% |
| 327 | Woking | £1,628 | -1.0% |
| 326 | Forest of Dean | £828 | -0.9% |
| 325 | Brighton and Hove | £1,816 | -0.8% |
By region
| Region | Typical area | Fastest |
|---|---|---|
| North East | +5.9% | Newcastle upon Tyne +7.9% |
| North West | +5.7% | Oldham +13.3% |
| West Midlands | +5.6% | Redditch +11.3% |
| Wales | +5.2% | Powys +8.6% |
| Yorkshire and The Humber | +5.2% | Kirklees +12.5% |
| East Midlands | +4.5% | Derbyshire Dales +10.1% |
| South West | +4.3% | Tewkesbury +14.4% |
| East of England | +3.7% | Great Yarmouth +7.1% |
| South East | +3.4% | Dover +10.2% |
| London | +3.3% | Southwark +7.3% |
| Scotland | +1.2% | West Lothian +9.3% |
“Typical area” is the median annual change across council areas in that region.
Downloads & images
- Every area as CSV (rank, rent, 1-year and 5-year change).
- Share image for the national story: home.png (1200×630).
- Every area has its own 1200×630 image at
/rent/og/<area>.png, linked from its page, e.g. Tewkesbury. - Embed code:
<a href="https://curiousjames.com/rent/"><img src="https://curiousjames.com/rent/og/home.png" alt="Rent Rises: every council area ranked" width="600"></a>
How to credit
“Source: ONS Price Index of Private Rents, analysed by Rent Rises (curiousjames.com/rent)”. Contains public sector information licensed under the Open Government Licence v3.0.
Method in one line
Average monthly private rent and annual change for each council area from the ONS Price Index of Private Rents, published 9:30am on 21 October 2026. It covers all private tenancies, not just asking rents, and is not adjusted for inflation. Scotland is published as 18 broad rental areas. Full method.
About
Rent Rises is built by James Brooks (Curious James), a self-described AI mad scientist who turns official data into tools anyone can use. Comment, custom cuts by bedroom size or a five-year view are available on request.