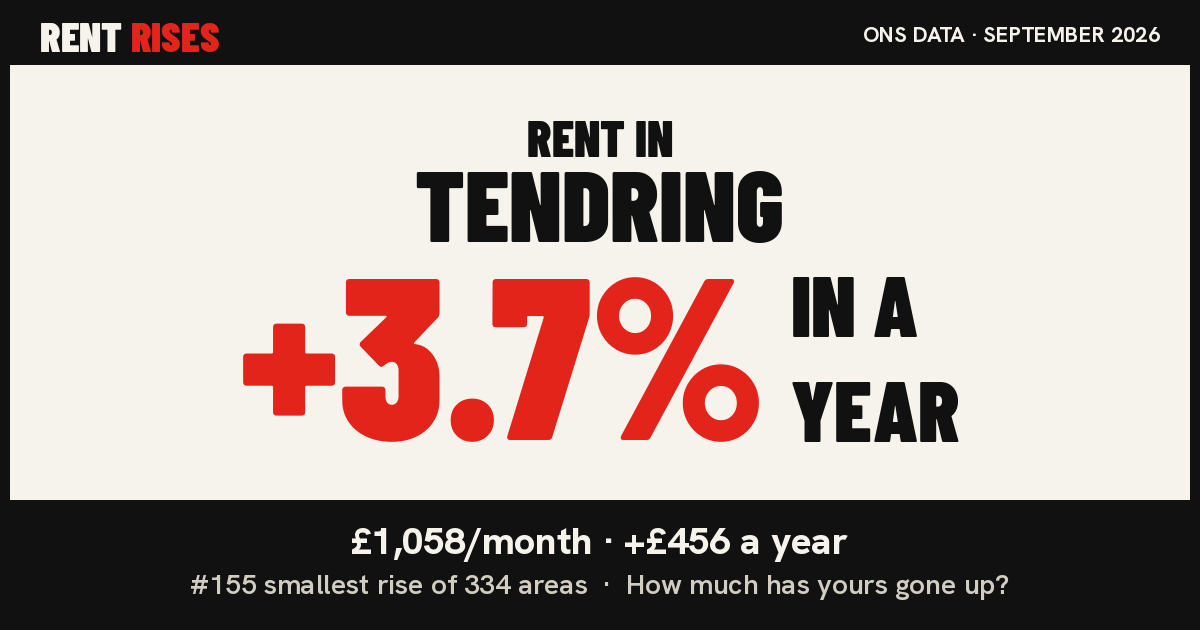
Rent in Tendring is up
+3.7%
The average private rent in Tendring is now £1,058 a month, £38 more than in September 2025. That's £456 a year more for the average renter. It's 180th of 334 areas, and 23rd of 45 in East of England.
Since 2015
━ Tendring ┅ UK average · average monthly private rent, all property types
How it compares
| Area | Avg rent | 1 year | 5 years |
|---|---|---|---|
| Tendring | £1,058 | +3.7% | +35% |
| East of England | £1,298 | +3.8% | +32% |
| England | £1,466 | +4.0% | +35% |
| UK | £1,406 | +3.8% | +35% |
Share card
By home size
| Type | Avg rent | 1 year |
|---|---|---|
| 1 bed | £761 | +3.7% |
| 2 bed | £979 | +3.7% |
| 3 bed | £1,192 | +3.8% |
| 4+ bed | £1,593 | +3.1% |
| Flat / maisonette | £887 | +3.4% |
| Terraced | £1,066 | +3.9% |
| Semi-detached | £1,141 | +3.9% |
| Detached | £1,319 | +3.5% |
Nearby in the table
Huntingdonshire +4.0%North Norfolk +4.0%Hertsmere +4.0%Luton +3.7%Fenland +3.7%King's Lynn and West Norfolk +3.6%
Source: ONS Price Index of Private Rents (area code E07000076), published 9:30am on 21 October 2026. Averages across all private tenancies, not asking rents. Five-year change compares September 2026 with September 2021. Method · Journalists